Friday, January 24, 2025

Difference Between ID Token, Access Token, and Refresh Token in OAuth & OpenID Connect

Understanding the Difference Between ID Token, Access Token, and Refresh Token in OAuth & OpenID Connect

OAuth 2.0 and OpenID Connect are widely used frameworks for authorization and authentication. These protocols use tokens to securely exchange and validate information between systems. However, understanding the purpose and difference between ID Token, Access Token, and Refresh Token can be challenging. In this article, we’ll break down each token and their specific roles in OAuth and OpenID Connect.

What Is an ID Token?

The ID Token is a JSON Web Token (JWT) issued by the identity provider (IdP) as part of the OpenID Connect protocol. Its primary purpose is to authenticate the user and confirm their identity to the client application. The ID Token contains information about the user, such as:

  • Subject (sub): A unique identifier for the user.
  • Issuer (iss): The identity provider that issued the token.
  • Expiration (exp): The token's validity period.
  • Claims: Additional information like the user’s email, name, or roles.
ID Token Scenario

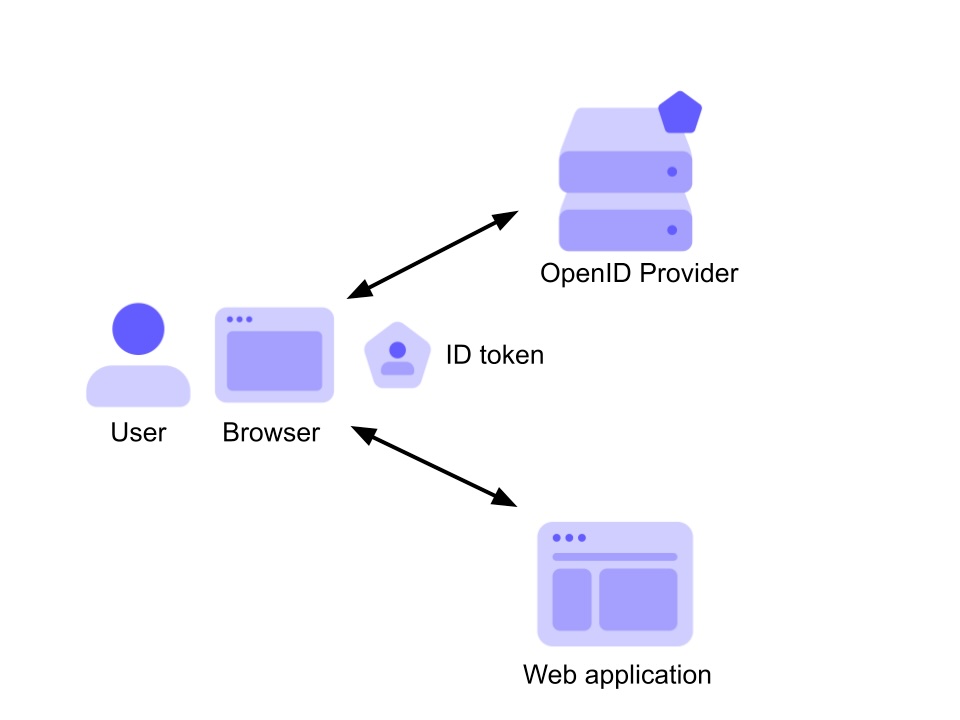
Illustration of an ID Token in action

What Is an Access Token?

The Access Token is a token issued by the authorization server, enabling the client application to access protected resources (such as APIs) on behalf of the user. Unlike the ID Token, the Access Token:

  • Does not contain user identity information.
  • Is designed to be presented to APIs or resource servers as proof of authorization.
  • Has a short lifespan for security purposes.
Access Token Scenario

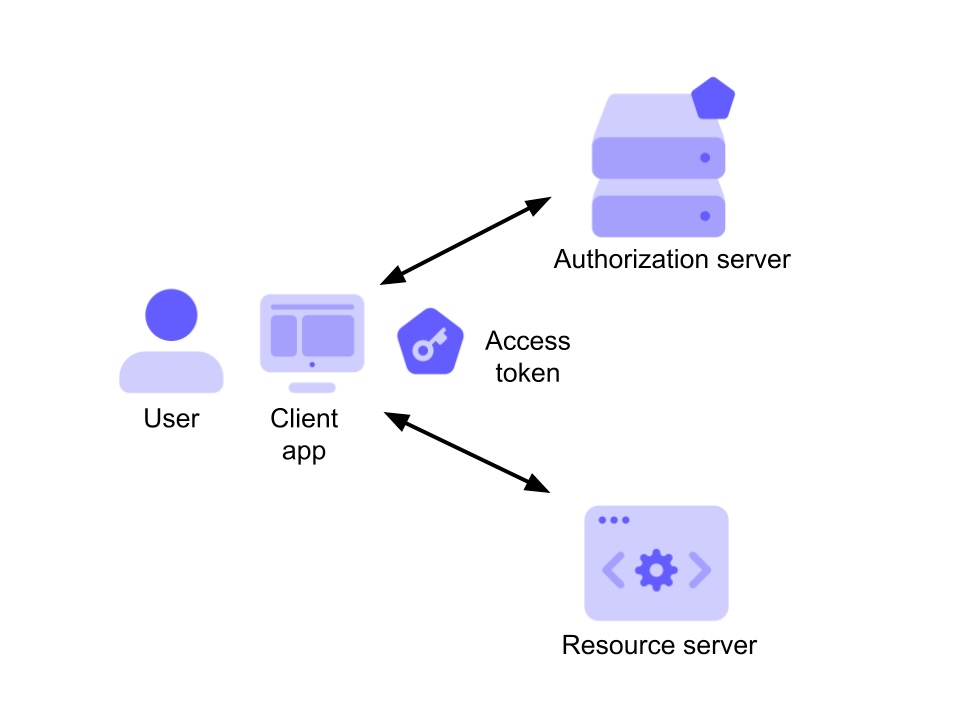
Illustration of an Access Token in action

What Is a Refresh Token?

The Refresh Token is a long-lived token used to obtain a new Access Token without requiring the user to log in again. It is issued alongside the Access Token during the authorization process and is stored securely by the client application. Refresh Tokens:

  • Are typically not sent to APIs or resource servers.
  • Have a longer validity period than Access Tokens.
  • Are subject to strict security practices to prevent misuse.

Key Differences at a Glance

Token Type Purpose Contains User Info? Intended Audience
ID Token User authentication and identity confirmation. Yes Client application
Access Token Authorize access to protected resources. No APIs or resource servers
Refresh Token Obtain new Access Tokens without re-authentication. No Authorization server
ID Token vs Access Token Summary

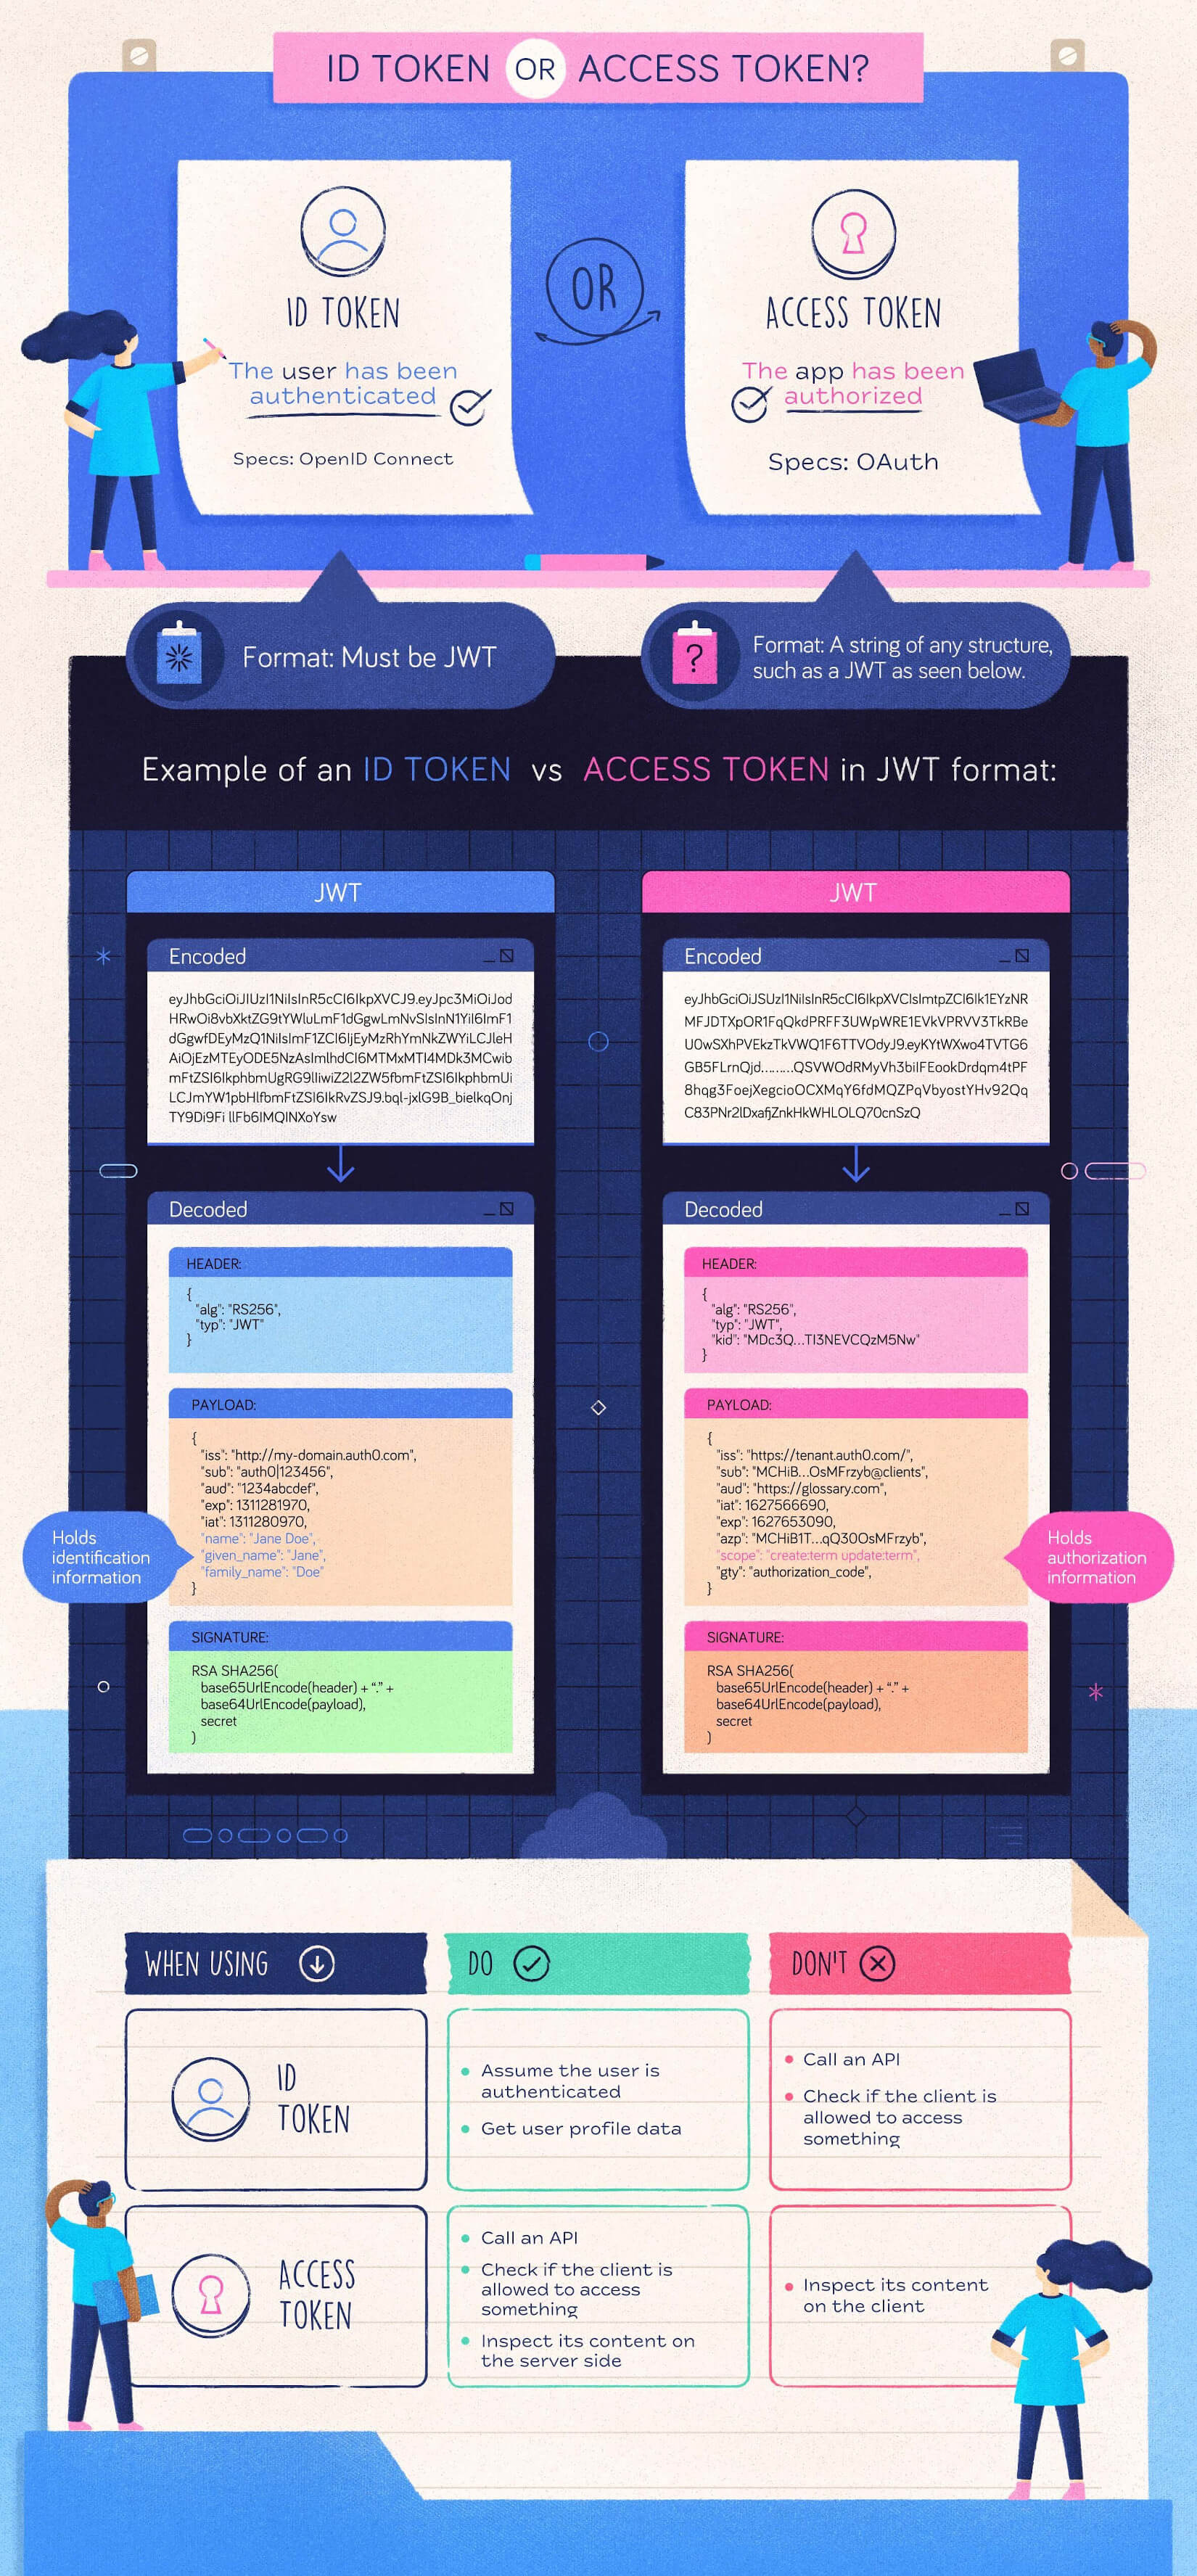
Summary: ID Token vs Access Token vs Refresh Token

Conclusion

Understanding the distinct roles of ID Tokens, Access Tokens, and Refresh Tokens is essential for designing secure and efficient authentication and authorization workflows. While the ID Token is central to user authentication, the Access Token ensures authorized API access, and the Refresh Token enhances user experience by reducing the need for frequent logins.

By using these tokens effectively, you can create robust and secure systems that adhere to modern authentication and authorization standards.

Thursday, January 23, 2025

Understanding Forwarded Headers Middleware in ASP.NET Core

🚀

Introduction

In modern web applications, especially those deployed behind reverse proxies (like Nginx, Apache, or cloud services like AWS and Azure), handling request headers correctly is crucial. The Forwarded Headers Middleware in ASP.NET Core ensures that proxies and load balancers pass the correct client information to the application.

This blog post will cover:
✅ What Forwarded Headers Middleware is
✅ Why it's important
✅ How to configure it in ASP.NET Core with a practical code example


🌟 What is Forwarded Headers Middleware?

When an application is deployed behind a reverse proxy, the proxy modifies request headers. For example:

  • The original client IP is replaced with the proxy server’s IP.
  • The HTTPS scheme may be removed if the proxy forwards requests via HTTP.

To ensure your app detects the correct client details, ASP.NET Core provides the Forwarded Headers Middleware.

🔹 Headers Managed by ForwardedHeadersMiddleware

1️⃣ X-Forwarded-For → Captures the original client IP.
2️⃣ X-Forwarded-Proto → Indicates the original HTTP scheme (HTTP or HTTPS).
3️⃣ X-Forwarded-Host → Contains the original host requested by the client.


🛠️ Configuring Forwarded Headers Middleware in ASP.NET Core

Let’s see how to enable and configure Forwarded Headers Middleware in an ASP.NET Core application.

1️⃣ Install Required Packages (Optional)

If not already installed, ensure the Microsoft.AspNetCore.HttpOverrides package is added:

dotnet add package Microsoft.AspNetCore.HttpOverrides

2️⃣ Configure Forwarded Headers Middleware in Program.cs

Modify your Program.cs file to include the middleware:

using Microsoft.AspNetCore.HttpOverrides;

var builder = WebApplication.CreateBuilder(args);
var app = builder.Build();

// 🌟 Enable Forwarded Headers Middleware
var options = new ForwardedHeadersOptions
{
    ForwardedHeaders = ForwardedHeaders.XForwardedFor | ForwardedHeaders.XForwardedProto
};

// 🔹 (Optional) Allow Known Proxies
options.KnownProxies.Add(System.Net.IPAddress.Parse("192.168.1.100")); 

app.UseForwardedHeaders(options);

// Sample Endpoint to Check Headers
app.MapGet("/", (HttpContext context) =>
{
    var clientIP = context.Connection.RemoteIpAddress?.ToString();
    var originalIP = context.Request.Headers["X-Forwarded-For"].ToString();
    var originalScheme = context.Request.Headers["X-Forwarded-Proto"].ToString();

    return Results.Json(new
    {
        ClientIP = clientIP,
        ForwardedFor = originalIP,
        ForwardedProto = originalScheme
    });
});

app.Run();

🔍 Understanding the Code

🔹 ForwardedHeadersOptions → Specifies which headers to process (X-Forwarded-For, X-Forwarded-Proto).
🔹 KnownProxies → Lists trusted proxies (important for security).
🔹 UseForwardedHeaders(options) → Enables the middleware before other request-processing middleware.
🔹 HttpContext.Request.Headers → Reads the forwarded headers inside an API endpoint.


⚡ Testing Forwarded Headers in Postman or Curl

You can simulate forwarded headers using Postman or cURL:

curl -H "X-Forwarded-For: 203.0.113.42" -H "X-Forwarded-Proto: https" http://localhost:5000

Expected Response (Example Output)

{
    "ClientIP": "::1",
    "ForwardedFor": "203.0.113.42",
    "ForwardedProto": "https"
}

📌 Best Practices

1️⃣ Only trust known proxies → Use KnownProxies or KnownNetworks to avoid spoofing risks.
2️⃣ Enable forwarding at the right stage → Configure before authentication middleware.
3️⃣ Use middleware only behind a proxy → Avoid unnecessary header processing in development.


🎯 Conclusion

The Forwarded Headers Middleware is essential for handling reverse proxy headers in ASP.NET Core applications. It ensures that the application correctly identifies the client IP address and scheme, improving security and logging accuracy.

🔥 Key Takeaways:
✅ Enables handling of X-Forwarded-For, X-Forwarded-Proto, and X-Forwarded-Host.
✅ Necessary for reverse proxy setups (e.g., Nginx, Cloudflare, AWS).
✅ Always configure trusted proxies for security.

👉 Have any questions? Drop them in the comments below! 🚀

Kestrel Web Server in .NET Core

Kestrel Web Server in .NET Core

The **Kestrel Web Server** is a cross-platform, lightweight, and high-performance web server designed specifically for applications built with **.NET Core**. It acts as the default web server for ASP.NET Core applications and is ideal for both development and production environments.

What is Kestrel?

Kestrel is an open-source web server built on top of the **libuv** library (used for asynchronous I/O operations) in earlier versions, but now it leverages **transport abstractions** in .NET for enhanced flexibility and performance. It is optimized for handling both static and dynamic content efficiently.

Key Features of Kestrel

  • Cross-Platform: Runs seamlessly on Windows, macOS, and Linux.
  • High Performance: Designed to handle thousands of concurrent requests with low latency.
  • Asynchronous I/O: Uses async programming patterns for efficient resource utilization.
  • Lightweight: Ideal for microservices and containerized applications.
  • Integration Friendly: Can be used with a reverse proxy like IIS, Nginx, or Apache, or as a standalone server.

How to Configure Kestrel in .NET Core

Configuring Kestrel in a .NET Core application is straightforward. Here's an example of how to set it up in the Program.cs file:


using Microsoft.AspNetCore.Hosting;
using Microsoft.Extensions.Hosting;

public class Program
{
    public static void Main(string[] args)
    {
        CreateHostBuilder(args).Build().Run();
    }

    public static IHostBuilder CreateHostBuilder(string[] args) =>
        Host.CreateDefaultBuilder(args)
            .ConfigureWebHostDefaults(webBuilder =>
            {
                webBuilder.UseKestrel(); // Configuring Kestrel
                webBuilder.UseStartup<Startup>();
            });
}


When to Use Kestrel

  • As a Standalone Server: For lightweight, high-performance applications, especially in microservice architectures.
  • With a Reverse Proxy: Use Kestrel behind IIS, Nginx, or Apache for additional features like load balancing, SSL termination, and security hardening.

Advantages of Kestrel

  • **Performance:** Its lightweight and asynchronous architecture makes it one of the fastest web servers available.
  • **Ease of Use:** Configuration and integration into .NET Core projects are straightforward.
  • **Extensibility:** Kestrel can handle advanced scenarios with middleware components.
"Kestrel is the backbone of ASP.NET Core applications, ensuring high performance and scalability while keeping the server lightweight and efficient."

Conclusion

The Kestrel Web Server is a critical component of the .NET Core ecosystem. Its high performance, lightweight nature, and cross-platform capabilities make it ideal for modern web applications. Whether used as a standalone server or behind a reverse proxy, Kestrel ensures your ASP.NET Core applications are fast, reliable, and production-ready.

Know this difference HTTP/1.1 vs HTTP/2.0

HTTP/1.1 vs HTTP/2.0

HTTP/1.1 vs HTTP/2.0

The evolution of the HTTP protocol from HTTP/1.1 to HTTP/2.0 brought significant performance and efficiency improvements. Let’s explore the differences between these two versions:

Key Differences

  • Multiplexing: HTTP/2.0 allows multiple requests and responses over a single connection, whereas HTTP/1.1 processes them sequentially.
  • Header Compression: HTTP/2.0 uses HPACK compression to minimize header size, improving efficiency compared to the plaintext headers in HTTP/1.1.
  • Binary Protocol: HTTP/2.0 uses a binary protocol, which is faster and less error-prone than HTTP/1.1’s text-based protocol.
  • Server Push: HTTP/2.0 can proactively send resources to the client before they’re requested, a feature missing in HTTP/1.1.
  • Prioritization: HTTP/2.0 allows prioritization of critical resources for faster loading times.
  • Encryption: While optional in HTTP/1.1, HTTP/2.0 implementations often require encryption (TLS).

Comparison Table

Feature HTTP/1.1 HTTP/2.0
Protocol Type Text-based Binary
Multiplexing Not supported Supported
Header Compression No Yes (HPACK)
Server Push Not supported Supported
Prioritization Not supported Supported
Connection Multiple connections needed Single connection sufficient
Security Optional TLS TLS usually required
"HTTP/2.0 is faster, more efficient, and better suited for modern web demands compared to HTTP/1.1."

Summary

In conclusion, HTTP/2.0 introduces significant improvements over HTTP/1.1, such as multiplexing, server push, and header compression, making it faster and more efficient. These enhancements are crucial for delivering a better web experience, particularly for resource-intensive websites.

Mastering Chrome Developer tool Tips and tricks

Basic Console Navigation & Shortcuts

  • Open Console Quickly: Use Ctrl + Shift + J (Windows/Linux) or Cmd + Option + J (Mac) to open the Console directly.
  • Clear Console Output: Use Ctrl + L or type clear() in the Console to clean up clutter.
  • Command Palette: Open the Command Menu with Ctrl + Shift + P (or Cmd + Shift + P on Mac).

Debugging with Console

  • Logging Data: Use console.log() to print variables or messages. For structured output, use console.table():
    const users = [{ name: 'Alice', age: 25 }, { name: 'Bob', age: 30 }];
    console.table(users);
                    
  • Inspect Objects: Use console.dir() to explore DOM elements or objects in detail.
  • Set Breakpoints: Right-click on the line number in the Sources tab to set breakpoints in your code.
  • Monitor Events: Use monitorEvents(element, 'event') to track events on an element:
    monitorEvents(document.body, 'click');
                    
  • Stop Monitoring Events: Use unmonitorEvents(element).

Using Fetch and Debugging Network Calls

  • Fetch Example:
    fetch('https://jsonplaceholder.typicode.com/posts/1')
      .then(response => response.json())
      .then(data => console.log(data))
      .catch(error => console.error('Error:', error));
                    
  • Check Network Logs: View the Network tab to analyze request/response headers, status codes, and payloads.
  • Retry Fetches: Copy fetch() calls directly from the Network tab by right-clicking a request and choosing "Copy as Fetch."
  • Breakpoint on XHR or Fetch: In the Sources > Event Listener Breakpoints, check "XHR Breakpoints" to pause execution whenever a request is sent.

Debugging JavaScript

  • Live Edit Code: In the Sources tab, modify code directly and hit Ctrl + S (or Cmd + S) to save and run updated scripts.
  • Pause Execution: Use the debugger; statement to pause execution where it's placed:
    function myFunction() {
      debugger; // Execution will pause here
      console.log('Debugging...');
    }
    myFunction();
                    
  • Conditional Breakpoints: Right-click on a breakpoint in the Sources tab and set a condition (e.g., i === 5).
  • Stack Traces: Use console.trace() to log the current stack trace.

DOM Debugging

  • Select DOM Elements: Use $0, $1, etc., to reference elements selected in the Elements tab.
  • Find Elements: Use $('selector') or $$('selector') for querying single or multiple elements:
    const buttons = $$('button');
    console.log(buttons);
                    
  • Modify Elements: Select an element in the Elements tab, then modify it in the Console:
    $0.style.color = 'red';
                    

Find Performance Benchmark

  • Measure Performance: Use console.time() and console.timeEnd() to measure code execution time:
    console.time('fetch-time');
    fetch('https://jsonplaceholder.typicode.com/posts')
      .then(response => response.json())
      .then(data => console.timeEnd('fetch-time'));
                    
  • Inspect JavaScript Functions: Type the function name in the Console to view its definition:
    console.log(myFunction.toString());
                    
  • Track Variable Changes: Use watch('variableName') in the Sources tab to monitor changes to specific variables.
  • Format JavaScript in Console: Use JSON.stringify(object, null, 2) to pretty-print objects:
    const data = { name: 'John', age: 25, city: 'New York' };
    console.log(JSON.stringify(data, null, 2));
                    

Find Unused Javascript

You can find unused JavaScript on your website by using the coverage tab in the Chrome DevTools. Press Ctrl/Cmd+Shift+p to open a command menu and type coverage to open the coverage tab. Now, click on the reload button within the coverage tab. The coverage tab tracks all the files and prepares a coverage list for you. Inside the list, you can see all the files have a usage visualisation graph. Click on a row to see the unused code in the sources tab.

Local File Override test changes before pushing to it production

  • Making changes to a production website is not ideal. If you break something, the whole website can go down. Is there a safe option to try out new things without actually changing the production code?
  • Local file overrides are a convenient feature for making tweaks to your website without changing the actual source code. Using local file overrides, you instruct Chrome to use your local modified files rather than using the files coming from the server.
  • To enable local file overrides, go to the sources tab of your Chrome DevTools and click on "enable local overrides". Now create a directory and give Chrome permission to save all the overrides in that directory.

Multiple Cursors One code many places

  • Ever have multiple lines you need to add something to? You can easily add multiple cursors by pressing Cmd + Click (Ctrl + Click) and entering information on multiple lines at the same time.

Capture Screenshots with dev tools

  • Capture a full-page screenshot.
  • Screenshot a node from the Elements panel.
  • Screenshot an area of a page.
  • Screenshot a node larger than the screen size.
  • Customize your screenshot.
  • Screenshot a mobile version of a website, and add a device frame.
  • Capture Screenshot videa

Make Readable Unminify JavaScript code

  • Code minifying is a build technique that is used to decrease the size of code files by removing indentations, spaces, and various other unnecessary things. Browsers can easily read and execute a minified file but for developers, reading a minified file is almost impossible.
  • Using Chrome DevTools, you can easily unminify a JavaScript file. Open the Chrome DevTools and go to the source tab. Then open a minified file from the left file explorer tab. Now click on the {} icon on the bottom of the file editor to unminify a file.

Record screen for automation

  • As a developer, you want to test how your website will react to different user flows. User flows are the journeys that users take on your website. It can be challenging to test a user flow manually, as you may need to repeat the same action again and again to mimic the user.
  • To record a user flow, open the Chrome DevTools and switch to the recorder tab. Now click on the red coloured recording button to start a new recording. Give your recording a unique name so that you can recognise it later. Now press the record button and perform the user flow that you want to record. All your actions, such as clicking buttons and navigating to other pages will be recorded. Once you've finished, click the end recording button, and your user flow is ready to replay. Now you can test your website with this flow automatically, without manual repetition.

© 2025 Don't waste your time on social media learn new things. All Rights Reserved.

Wednesday, January 22, 2025

Content Security Policy Report Only

Content Security Policy (CSP) and Reporting for Client Scripts

Content Security Policy (CSP) is a powerful browser feature that helps protect web applications from cross-site scripting (XSS) and other code injection attacks. By controlling which resources a browser can load, CSP enhances security and ensures that only trusted scripts are executed on your website.

What is Content Security Policy (CSP)?

CSP is a security standard that defines rules for loading content in web applications. These rules specify what types of content can be loaded and from which sources, thus reducing the risk of malicious attacks.

CSP for First-Party, Second-Party, Third-Party, and Fourth-Party Client Scripts

  • First-Party Scripts: These are scripts served directly from the same domain as your application. For example, if your website is https://example.com, any JavaScript file served from this domain, such as https://example.com/script.js, is considered first-party. These scripts are typically trusted, and CSP rules often allow them without restrictions.
  • Second-Party Scripts: These scripts come from trusted subdomains or partner domains. For instance, if you have a trusted analytics partner providing services from https://partner.example.com, their scripts would fall under second-party. CSP can be configured to allow such scripts explicitly:
    script-src 'self' https://partner.example.com;
  • Third-Party Scripts: These scripts originate from external sources such as ad networks, social media widgets, or analytics providers. For example, scripts from https://cdn.analytics.com or https://ads.provider.com would be classified as third-party. Allowing third-party scripts requires careful consideration to avoid introducing vulnerabilities. CSP rules can whitelist specific domains:
    script-src 'self' https://cdn.analytics.com https://ads.provider.com;
  • Fourth-Party Scripts: These are scripts loaded indirectly by third-party scripts. For example, if a script from https://cdn.analytics.com dynamically loads another script from https://another-provider.com, the latter is considered a fourth-party script. These scripts are the most challenging to control and pose significant security risks. CSP cannot directly specify these scripts unless they are explicitly loaded, making it essential to audit and monitor all third-party dependencies.

Using CSP with Report-Only Mode

Report-Only mode in CSP allows you to test policies without enforcing them. Violations are logged, enabling you to refine your rules before applying them. Here’s an example:

Content-Security-Policy-Report-Only: 
  default-src 'self'; 
  script-src 'self' https://trusted-partner.com; 
  report-uri /csp-violation-report-endpoint;

Full CSP Example for Client Scripts

The following is a complete example of a CSP header for managing first-party, second-party, and third-party scripts:

Content-Security-Policy: 
  default-src 'self'; 
  script-src 'self' https://trusted-partner.com https://analytics-provider.com; 
  style-src 'self' 'unsafe-inline'; 
  img-src 'self' https://images-provider.com; 
  connect-src 'self'; 
  report-uri /csp-violation-report-endpoint;

Benefits of Using CSP

  • Reduced Attack Surface: By specifying trusted sources, CSP minimizes the risk of malicious code execution.
  • Better Visibility: With report-only mode, you gain insights into potential violations and refine your policies.
  • Improved User Trust: A secure application boosts user confidence.

Conclusion

Implementing CSP is a critical step towards securing modern web applications. By carefully defining policies for first-party, second-party, third-party, and fourth-party client scripts, you can significantly reduce vulnerabilities and protect your users.

Why Swagger is Dead and .NET 9.0 Removed Swashbuckle

Why Swagger is Dead and .NET 9.0 Removed Swashbuckle

The software development landscape is constantly evolving, and tools that once seemed indispensable often fall by the wayside. Swagger, a popular API documentation tool, has recently been deemed outdated by many developers. This shift is reflected in .NET 9.0, which has officially removed support for Swashbuckle, the .NET implementation of Swagger.

Why Swagger is Considered Outdated

Swagger revolutionized API documentation by providing a user-friendly interface for exploring APIs. However, over time, several limitations became apparent:

  • Performance Issues: Swagger struggles with large-scale APIs, leading to slow rendering and navigation.
  • Limited Customization: While useful, Swagger’s UI offers limited flexibility for modern design requirements.
  • Emergence of Alternatives: Tools like OpenAPI and GraphQL provide more robust and flexible solutions.

What Replaces Swashbuckle in .NET 9.0?

.NET 9.0 introduces a shift towards better integration with OpenAPI specifications and native API documentation tools. Key replacements include:

  • Minimal APIs: Simplified API structures reduce the need for external documentation tools.
  • Native OpenAPI Support: Microsoft has improved OpenAPI integration for seamless API documentation.
  • Improved Developer Experience: Features like endpoint summaries and IntelliSense annotations make documentation easier.

Code Example: Using OpenAPI in .NET 9.0

// Enable OpenAPI in your ASP.NET Core application
var builder = WebApplication.CreateBuilder(args);

builder.Services.AddEndpointsApiExplorer();
builder.Services.AddSwaggerGen();

var app = builder.Build();

if (app.Environment.IsDevelopment()) {
    app.UseSwagger();
    app.UseSwaggerUI();
}

app.MapGet("/api/hello", () => "Hello, World!")
    .WithName("GetHello")
    .WithOpenApi();

app.Run();

Advantages of Moving Away from Swagger

By phasing out Swashbuckle, .NET developers can benefit from:

  • Enhanced Performance: OpenAPI and other alternatives handle large APIs more efficiently.
  • Modern Features: Support for advanced configurations and integrations with CI/CD pipelines.
  • Better Developer Tools: Native solutions reduce dependency on external libraries.

Conclusion

While Swagger and Swashbuckle have served the developer community well, the move towards modern tools like OpenAPI signifies a natural progression in API development. .NET 9.0’s decision to remove Swashbuckle underscores the importance of embracing more efficient, flexible, and integrated solutions.

Azure AD B2C vs Microsoft Entra: Key Differences

Azure AD B2C vs Microsoft Entra: Key Differences

When building secure and scalable applications, choosing the right identity platform is crucial. Two popular offerings from Microsoft, Azure Active Directory B2C (Azure AD B2C) and Microsoft Entra, serve different purposes. Let’s dive into their differences to help you decide which one fits your needs.

What is Azure AD B2C?

Azure Active Directory B2C (Business-to-Consumer) is an identity management service tailored for customer-facing applications. It enables developers to authenticate users with social accounts or custom credentials, offering a seamless user experience.

Key Features of Azure AD B2C:

  • Customizable user flows for login, registration, and password reset.
  • Integration with social identity providers like Google, Facebook, and LinkedIn.
  • Support for multi-factor authentication (MFA).
  • Branding options for tailored user experiences.

What is Microsoft Entra?

Microsoft Entra is a suite of identity and access management solutions that includes Azure AD. It focuses on securing access to resources across enterprises, ensuring zero-trust principles, and managing identities for employees, partners, and systems.

Key Features of Microsoft Entra:

  • Enterprise-grade identity management for employees and partners.
  • Integration with hybrid cloud environments.
  • Advanced security features like conditional access and identity protection.
  • Support for seamless single sign-on (SSO).

Azure AD B2C vs Microsoft Entra: A Side-by-Side Comparison

Feature Azure AD B2C Microsoft Entra
Target Audience External customers Enterprise employees and partners
Authentication Options Social and local accounts Enterprise credentials
Use Case Customer-facing apps Enterprise resource access
Custom Branding Extensive support Limited

Which One Should You Choose?

If your primary focus is on creating customer-facing applications with customizable user experiences, Azure AD B2C is the right choice. However, if your goal is to manage enterprise identities and secure access to corporate resources, Microsoft Entra is more suitable.

© 2025 Cloud Identity Insights. All rights reserved.

Speeding Up ASP.NET Framework Unit Tests in Azure DevOp

Speeding Up ASP.NET Framework Unit Tests in Azure DevOps

Unit tests are critical for ensuring code quality, but their execution time can often slow down your CI/CD pipeline. In this article, we’ll explore strategies to accelerate unit test execution for ASP.NET Framework applications in Azure DevOps pipelines.

1. Optimize Test Parallelization

Parallelizing your tests can significantly reduce execution time. Ensure your tests are independent and can run in parallel without shared state conflicts. Use the RunSettings file to enable parallel test execution:


<!-- RunSettings file -->
<?xml version="1.0" encoding="utf-8"?>
<RunSettings>
  <RunConfiguration>
    <MaxCpuCount>4</MaxCpuCount>
  </RunConfiguration>
</RunSettings>
    

Include this file in your pipeline configuration.

2. Use Test Filters

Run only the necessary tests by using test filters. This is particularly useful when you’re working on a specific feature or bug fix. Update your pipeline YAML as follows:


- task: VSTest@2
  inputs:
    testSelector: 'testAssemblies'
    testAssemblyVer2: '**/*Tests.dll'
    testFiltercriteria: 'TestCategory=SmokeTest'
    runSettingsFile: '$(System.DefaultWorkingDirectory)/RunSettings.runsettings'
    diagnosticsEnabled: true
    platform: '$(BuildPlatform)'
    configuration: '$(BuildConfiguration)'
    publishRunAttachments: true
    runInParallel: true
    codeCoverageEnabled: true
    testRunTitle: 'Smoke Test Execution'
    failOnMinCoverage: true
    runTestsInIsolation: true
    rerunFailedTests: true
    testRunParameters: >
      DatabaseConnectionString=$(DatabaseConnectionString);
    # Insert appropriate environment variables here.
      ServiceName=$(ServiceName);

    pipelineConfig:
      Use templates in jobs. Use mock dynamic variables to ensure business units are scoped contextually to their parent org structure

Nextjs Template vs Layout

Template vs Layout in Next.js

When working with Next.js, understanding the difference between Templates and Layouts is crucial for structuring your application effectively. Let’s break down the key differences and explore examples.

What is a Layout in Next.js?

A Layout is a component that wraps around multiple pages to provide a consistent look and feel across your application. Common examples include headers, footers, and sidebars.


// components/Layout.js
export default function Layout({ children }) {
  return (
    <div>
      <header>My Header</header>
      <main>{children}</main>
      <footer>My Footer</footer>
    </div>
  );
}
    

To use a layout, wrap it around your pages:


// pages/_app.js
import Layout from '../components/Layout';

export default function MyApp({ Component, pageProps }) {
  return (
    <Layout>
      <Component {...pageProps} />
    </Layout>
  );
}
    

What is a Template in Next.js?

A Template is more specific than a layout. It structures parts of a page, such as dynamic content or specific sections. Templates are reusable within a single page or across a subset of pages.


// components/Template.js
export default function Template({ title, content }) {
  return (
    <section>
      <h1>{title}</h1>
      <p>{content}</p>
    </section>
  );
}
    

Here’s how you might use a template within a page:


// pages/example.js
import Template from '../components/Template';

export default function ExamplePage() {
  return (
    <Template title="About Us" content="We are a global company." />
  );
}
    

Key Differences Between Templates and Layouts

  • Scope: Layouts are used across multiple pages, while templates are typically page-specific.
  • Purpose: Layouts provide a consistent structure, whereas templates structure individual page sections.
  • Implementation: Layouts are usually defined in _app.js, while templates are imported directly into pages.

Combining Templates and Layouts

It’s common to use layouts and templates together. For example, a layout might wrap the overall structure, while templates define the content within individual pages.


// pages/contact.js
import Layout from '../components/Layout';
import Template from '../components/Template';

export default function ContactPage() {
  return (
    <Layout>
      <Template title="Contact Us" content="Reach out via email or phone." />
    </Layout>
  );
}
    

© 2025 Next.js Insights. All rights reserved.

React.js Hacks Every Developer Should Know

React.js is one of the most popular JavaScript libraries for building user interfaces, but mastering it goes beyond just the basics. Here are some React.js hacks and tips that can help you write cleaner, more efficient, and maintainable code.


1. Lazy Loading Components for Faster Performance

Using React.lazy() and React.Suspense, you can load components only when they're needed, improving page load speed.

jsx
const LazyComponent = React.lazy(() => import('./LazyComponent')); function App() { return ( <React.Suspense fallback={<div>Loading...</div>}> <LazyComponent /> </React.Suspense> ); }

💡 Pro Tip: Use lazy loading for large components or routes to enhance user experience.


2. Boost Performance with React.memo()

Prevent unnecessary re-renders of functional components using React.memo().

jsx
const MyComponent = React.memo(({ value }) => { console.log('Rendered'); return <div>{value}</div>; });

🔑 Key Benefit: If the props don’t change, React skips rendering the component, saving resources.


3. Simplify Logic with Custom Hooks

Reusable custom hooks save time and effort by encapsulating logic.

jsx
function useFetch(url) { const [data, setData] = React.useState(null); React.useEffect(() => { fetch(url) .then((response) => response.json()) .then(setData); }, [url]); return data; }

🎯 Why Use It? This approach eliminates duplicate code and improves maintainability.


4. Manage Styles Easily with classnames

Conditional styling can be cleaner and more manageable using the classnames library.

jsx
import classNames from 'classnames'; const Button = ({ isActive }) => { return ( <button className={classNames('btn', { 'btn-active': isActive })}> Click Me </button> ); };

Tip: It’s a lifesaver when dealing with dynamic classes in large apps.


5. Avoid Prop Drilling with Context API

The Context API eliminates the need to pass props through multiple layers.

jsx
const ThemeContext = React.createContext(); function App() { return ( <ThemeContext.Provider value="dark"> <Toolbar /> </ThemeContext.Provider> ); } function ThemedButton() { const theme = React.useContext(ThemeContext); return <button className={theme}>Themed Button</button>; }

📌 Quick Fix: Replace excessive prop drilling with useContext() for cleaner code.


6. Graceful Error Handling with Error Boundaries

Ensure your app doesn’t break completely by using Error Boundaries.

jsx
class ErrorBoundary extends React.Component { state = { hasError: false }; static getDerivedStateFromError() { return { hasError: true }; } render() { if (this.state.hasError) { return <h1>Something went wrong.</h1>; } return this.props.children; } }

🚨 Hack: Wrap components in ErrorBoundary to display fallback UIs for errors.


7. Cleaner DOM with Fragments

Avoid unnecessary wrappers in your DOM tree by using React Fragments.

jsx
function MyComponent() { return ( <> <h1>Title</h1> <p>Paragraph</p> </> ); }

Why It Matters: Reduces the extra <div> elements in your DOM.


8. Say No to Inline Functions

Inline functions inside JSX can hurt performance. Move them outside to avoid re-creation on every render.

jsx
function App() { const handleClick = () => console.log('Clicked'); return <button onClick={handleClick}>Click Me</button>; }

🚀 Hack: Define functions outside the render method for better performance.


9. Simplify Conditional Rendering

Use logical operators to clean up conditional UI.

jsx
{isLoggedIn && <p>Welcome back!</p>} {!isLoggedIn && <p>Please log in.</p>}

💡 Pro Tip: Simplify conditions with && or ternary operators.


10. Use Hot Module Replacement (HMR)

Preserve your app’s state while developing by enabling HMR.

bash
npm install react-refresh

Set up in your webpack.config.js:

js
plugins: [new ReactRefreshWebpackPlugin()],

🔥 Why Use It? Speeds up development and retains component state.


11. Handle State Immutably with Immer.js

Update state easily while maintaining immutability.

bash
npm install immer
jsx
import produce from 'immer'; const [state, setState] = useState({ items: [] }); const addItem = (item) => { setState((currentState) => produce(currentState, (draft) => { draft.items.push(item); }) ); };

🔧 Hack: Immer simplifies complex state updates with minimal boilerplate.


12. Analyze Performance with React DevTools Profiler

React DevTools’ Profiler tab is invaluable for optimizing performance.

💻 Steps to Use:

  1. Install the React Developer Tools extension.
  2. Open the "Profiler" tab in your browser DevTools.
  3. Identify components with high rendering costs and optimize them.

Conclusion

By incorporating these React.js hacks into your development workflow, you can write more efficient, maintainable, and performance-optimized applications. Whether it’s lazy loading, memoization, or using custom hooks, each hack is designed to simplify your coding experience.

👉 Which of these hacks is your favorite? Let us know in the comments!


Disclaimer: This post is for informational purposes only. Always evaluate techniques based on your specific use case and project requirements.

Share this Post

🌟 If you found this useful, don’t forget to share it with your fellow developers!