Monday, May 26, 2025

Azure Application Gateway vs Azure Traffic Manager

 Azure Application Gateway and Azure Traffic Manager are both load-balancing solutions in Azure, but they serve different purposes and operate at different layers of the network stack.


🔍 Quick Comparison

Feature Application Gateway Traffic Manager
Network Layer Layer 7 (Application layer, HTTP/HTTPS) Layer 4/7 (DNS-based redirection)
Load Balancing Method Reverse proxy DNS-based redirection
Use Case Load balance within a region Route traffic across regions
Protocol Support HTTP, HTTPS (Web traffic) Any protocol (DNS-based, so protocol-agnostic)
Geographic Routing ❌ (single region only) ✅ (multi-region and geo-based routing)
SSL Termination ✅ Yes ❌ No (doesn't touch actual traffic)
Web Application Firewall ✅ Built-in WAF ❌ No
Health Probing ✅ Application-level (URLs, HTTP status) ✅ Endpoint-based (simple HTTP checks)
Sticky Sessions / Affinity ✅ Yes ❌ No
Multi-region Failover ❌ No (used per region) ✅ Yes
Custom Domain Routing ✅ Path-based & domain-based ✅ Domain-based only (via DNS)

🛠️ When to Use Each

Use Application Gateway when:

  • You need layer 7 load balancing within a single Azure region.

  • You want to do SSL termination, cookie-based session affinity, or URL/path-based routing.

  • You want to use Web Application Firewall (WAF).

  • You’re deploying web apps (e.g., in App Services, VMs, AKS) behind a reverse proxy.

Use Traffic Manager when:

  • You want to route users to the closest or healthiest Azure region (e.g., for geo-redundant services).

  • You need DNS-based global failover or performance-based routing.

  • Your endpoints span multiple Azure regions, or even outside Azure.

  • You're working with non-HTTP services (e.g., SMTP, FTP, custom ports).


🔄 Can They Work Together?

Yes! In a high-availability architecture:

  • Traffic Manager is used to direct global clients to the best region (e.g., East US or West Europe).

  • Each region uses its own Application Gateway to manage and protect internal traffic.

🧭 Diagram:

                    User
                      |
           +---------------------+
           |  Traffic Manager    |
           +---------------------+
             /            \
   [App Gateway 1]     [App Gateway 2]
     (Region A)           (Region B)
         |                   |
    Web Apps/VMs       Web Apps/VMs

🧠 Summary

You want to... Use...
Load balance HTTP/HTTPS traffic in-region Application Gateway
Distribute traffic across regions/globally Traffic Manager
Route by URL or path Application Gateway
Route by region or endpoint health Traffic Manager

Let me know if you want help choosing for your specific architecture or a cost comparison.
Tuesday, April 1, 2025

Real time Use case scenario of MCP


Real-World Use Case of the MCP Model

A practical example of implementing the MCP model can be seen in autonomous vehicles:

  1. Model:

    • The autonomous vehicle's control system is built using machine learning and sensor fusion.

    • The model includes algorithms for object detection, route planning, and real-time decision-making.

  2. Context:

    • The environment in which the vehicle operates, including road conditions, weather, traffic laws, and pedestrian activity.

    • External factors like real-time GPS data, vehicle-to-vehicle communication, and regulatory constraints.

  3. Process:

    • The vehicle continuously collects sensor data to adjust its decisions dynamically.

    • It follows programmed processes to navigate through different traffic scenarios.

    • Adaptability ensures the vehicle can handle unexpected obstacles or environmental changes.

This real-world example showcases how the MCP model helps ensure autonomous systems operate effectively by integrating contextual awareness and adaptive processes.

Challenges in Defining MCP Model Context

Despite its importance, defining and managing the MCP model context presents several challenges:

  • Dynamic Nature: The context is often changing, requiring continuous monitoring and updates.

  • Complex Interdependencies: Multiple contextual factors can interact in unpredictable ways.

  • Data Overload: Identifying relevant contextual information from large datasets can be difficult.

  • Bias and Subjectivity: Misinterpretation or neglect of certain contextual factors can lead to biased models and ineffective processes.

Implementing the MCP Model

To effectively implement the MCP model, follow these steps:

  1. Define the Model:

    • Identify the key components of the system you want to represent.

    • Establish the rules, relationships, and constraints within the model.

  2. Analyze the Context:

    • Gather relevant data about external and internal factors.

    • Identify constraints, limitations, and dependencies affecting the model.

    • Continuously monitor and update contextual factors as needed.

  3. Develop the Process:

    • Design workflows and procedures that interact with the model within its context.

    • Ensure flexibility to adapt to changes in the context.

    • Optimize processes for efficiency and effectiveness.

  4. Test and Validate:

    • Conduct simulations and real-world testing to evaluate the model’s performance.

    • Adjust the model and processes based on feedback and evolving context.

  5. Iterate and Improve:

    • Continuously refine the model and processes based on new insights.

    • Stay updated with changes in the contextual environment to maintain relevance.

Conclusion

The MCP Model Context is a fundamental concept that ensures the effectiveness of models and processes by considering the external and internal factors influencing them. Understanding the context allows for better decision-making, adaptability, and practical applications across multiple domains. As technology and industries continue to evolve, integrating contextual awareness into the MCP model remains a key factor for success. By following a structured approach to implementation, organizations and individuals can leverage the MCP model to enhance decision-making, optimize processes, and achieve better outcomes.

In the making of MCP Model Context Process AI


Introduction

The MCP (Model, Context, and Process) Model is a framework used in various domains, including software engineering, business analysis, and cognitive sciences. It provides a structured approach to understanding complex systems by breaking them down into three interrelated components: Model, Context, and Process. This article explores the MCP model context, its significance, and its applications across different fields.

What is the MCP Model?

The MCP model consists of three key elements:

  1. Model: A representation of a system, concept, or entity that simplifies and abstracts real-world complexities.

  2. Context: The surrounding environment, conditions, and constraints that influence the model.

  3. Process: The procedures, transformations, or activities that interact with the model within its context.

The MCP model context specifically refers to the circumstances, factors, and conditions that define the environment in which the model operates. Understanding the context is crucial as it helps in designing effective processes and ensures the model remains relevant and functional.

Importance of Context in the MCP Model

The context plays a significant role in ensuring that the model and processes remain adaptable and practical. Some key reasons why context is crucial include:

  • Defining Scope: It helps determine the boundaries and limitations of the model.

  • Influencing Decisions: The context affects decision-making by providing relevant external and internal factors.

  • Enhancing Relevance: A model designed without considering its context may not be effective or applicable in real-world scenarios.

  • Ensuring Adaptability: As the context changes, the model and processes must be flexible enough to adjust accordingly.

Applications of MCP Model Context

The concept of MCP model context is widely used across different industries and disciplines. Some notable applications include:

  1. Software Development:

    • In software engineering, the MCP model helps in designing adaptable software architectures.

    • The context includes user requirements, technological constraints, and industry standards.

  2. Business Strategy:

    • Businesses use the MCP model to align their strategies with market conditions.

    • The context involves economic trends, customer preferences, and competitive landscapes.

  3. Artificial Intelligence and Machine Learning:

    • AI models rely on contextual data to improve accuracy and decision-making.

    • The context includes data sources, biases, and regulatory requirements.

  4. Healthcare Systems:

    • The MCP model helps in developing patient-centric healthcare solutions.

    • The context involves medical guidelines, patient history, and healthcare policies.

  5. Education and Learning:

    • The MCP model is used to design adaptive learning systems.

    • The context includes student backgrounds, learning preferences, and curriculum standards.

Challenges in Defining MCP Model Context

Despite its importance, defining and managing the MCP model context presents several challenges:

  • Dynamic Nature: The context is often changing, requiring continuous monitoring and updates.

  • Complex Interdependencies: Multiple contextual factors can interact in unpredictable ways.

  • Data Overload: Identifying relevant contextual information from large datasets can be difficult.

  • Bias and Subjectivity: Misinterpretation or neglect of certain contextual factors can lead to biased models and ineffective processes.

Conclusion

The MCP Model Context is a fundamental concept that ensures the effectiveness of models and processes by considering the external and internal factors influencing them. Understanding the context allows for better decision-making, adaptability, and practical applications across multiple domains. As technology and industries continue to evolve, integrating contextual awareness into the MCP model remains a key factor for success.

Thursday, March 6, 2025

Functional UI testing using AI test tool

 There are several AI-powered tools for automation testing, depending on your needs. Here are some of the top AI testing tools:

1. Testim

  • Uses AI to speed up test creation, execution, and maintenance
  • Self-healing tests to reduce flaky failures
  • Supports web and mobile testing

2. Mabl

  • AI-powered UI testing with auto-healing
  • Supports API testing and cross-browser testing
  • Integrates with CI/CD pipelines

3. Katalon Studio

  • AI-assisted test generation and maintenance
  • Supports web, API, mobile, and desktop testing
  • Low-code and script-based automation

4. Applitools

  • AI-driven visual testing and monitoring
  • Detects UI inconsistencies using visual AI
  • Integrates with Selenium, Cypress, and other frameworks

5. Functionize

  • AI-powered cloud-based test automation
  • Self-healing and natural language test creation
  • Scales across different environments

6. Test.ai

  • AI-powered test automation for mobile apps
  • No need for coding or test scripts
  • Uses machine learning to adapt tests automatically

7. UiPath Test Suite

  • AI-based automation for RPA and software testing
  • Supports web, mobile, and desktop applications
  • Integrates with CI/CD pipelines


Sunday, February 16, 2025

Azure Keyvault secret change notification using Event Grid Subscription and Logic App or Azure function

 To create triggers for changes in Azure Key Vault secrets, you can leverage Azure Event Grid by setting up an event subscription on your Key Vault that will fire an event whenever a secret is updated, deleted, or created, allowing you to then configure an action like a Logic App or Azure Function to respond to these changes. 

Key steps:
  • Configure Event Grid subscription:
    • Go to your Azure Key Vault in the portal. 
    • Navigate to the "Events" tab. 
    • Select "Create event grid subscription". 
    • Choose a suitable Event Grid topic or create a new one. 
    • Select the event types you want to monitor, such as "SecretNewVersionCreated" or "SecretNearExpiry". 
  • Create a consuming application:
    • Logic App: Set up a Logic App with an Event Grid trigger that will be activated when an event is published by your Key Vault. 
    • Azure Function: Develop an Azure Function that is triggered by the Event Grid event and performs the desired actions based on the secret change. 
    Important considerations:
    • Access control:
      Ensure your consuming application (Logic App or Function) has the necessary permissions to access your Key Vault to read the updated secret values. 
    • Filtering events:
      You can filter the events received by your consuming application based on specific secret names or other criteria using Event Grid filters. 
    Example use cases for secret change triggers:
    • Automatic application reconfiguration: When a secret is updated in Key Vault, trigger a deployment to update your application configuration with the new secret value. 
    • Notification alerts: Send notifications to administrators when critical secrets are changed or near expiry. 
    • Data synchronization: Update data in another system based on changes to a secret in Key Vault. 

Friday, February 14, 2025

AKS docker Persistent Volume to decouple .net code deploy without rebuilding image and container

 Here’s how you can implement some of these methods to decouple your .NET web app’s source code deployment from the AKS container image:


1. Use Persistent Volume (PV) and Persistent Volume Claim (PVC)

This method mounts an external Azure Storage account into the AKS pod, allowing your app to read the latest source code without rebuilding the image.

Steps to Implement:

  1. Create an Azure File Share:

    az storage account create --name mystorageaccount --resource-group myResourceGroup --location eastus --sku Standard_LRS
    az storage share create --name myfileshare --account-name mystorageaccount
    
  2. Create a Kubernetes Secret for Storage Credentials:

    kubectl create secret generic azure-secret \
      --from-literal=azurestorageaccountname=mystorageaccount \
      --from-literal=azurestorageaccountkey=$(az storage account keys list --resource-group myResourceGroup --account-name mystorageaccount --query '[0].value' --output tsv)
    
  3. Define a Persistent Volume (PV) and Persistent Volume Claim (PVC):

    apiVersion: v1
    kind: PersistentVolume
    metadata:
      name: azurefile-pv
    spec:
      capacity:
        storage: 5Gi
      accessModes:
        - ReadWriteMany
      azureFile:
        secretName: azure-secret
        shareName: myfileshare
        readOnly: false
    ---
    apiVersion: v1
    kind: PersistentVolumeClaim
    metadata:
      name: azurefile-pvc
    spec:
      accessModes:
        - ReadWriteMany
      resources:
        requests:
          storage: 5Gi
    
  4. Mount the Storage in Your Deployment:

    apiVersion: apps/v1
    kind: Deployment
    metadata:
      name: my-dotnet-app
    spec:
      replicas: 1
      selector:
        matchLabels:
          app: my-dotnet-app
      template:
        metadata:
          labels:
            app: my-dotnet-app
        spec:
          containers:
          - name: my-dotnet-app
            image: myacr.azurecr.io/mydotnetapp:latest
            volumeMounts:
            - name: azurefile
              mountPath: /app
          volumes:
          - name: azurefile
            persistentVolumeClaim:
              claimName: azurefile-pvc
    
  5. Deploy the Updated App to AKS:

    kubectl apply -f deployment.yaml
    

Now, your .NET app will dynamically read source code from the Azure File Share without rebuilding the container.


2. Use Sidecar Pattern with a Shared Volume

This method runs a second container inside the same pod to fetch and update the source code.

Steps to Implement:

  1. Modify the Deployment YAML to Add a Sidecar:

    apiVersion: apps/v1
    kind: Deployment
    metadata:
      name: my-dotnet-app
    spec:
      replicas: 1
      selector:
        matchLabels:
          app: my-dotnet-app
      template:
        metadata:
          labels:
            app: my-dotnet-app
        spec:
          volumes:
          - name: shared-volume
            emptyDir: {}
          containers:
          - name: my-dotnet-app
            image: myacr.azurecr.io/mydotnetapp:latest
            volumeMounts:
            - name: shared-volume
              mountPath: /app
          - name: sidecar-git-sync
            image: alpine/git
            command: ["sh", "-c", "while true; do git pull origin main; sleep 60; done"]
            volumeMounts:
            - name: shared-volume
              mountPath: /app
    
  2. Ensure the Sidecar Has Access to the Repo:

    • Store SSH keys or tokens in Kubernetes secrets.
    • Modify the Git sync command to fetch from your repository.
  3. Deploy to AKS:

    kubectl apply -f deployment.yaml
    

Now, the sidecar container will fetch code updates every 60 seconds, and your app container will read from the shared volume.


3. Use .NET Hot Reload with Volume Mounting

This method allows live updates to your .NET web app inside an AKS pod.

Steps to Implement:

  1. Modify Your .NET Dockerfile to Enable Hot Reload:

    FROM mcr.microsoft.com/dotnet/aspnet:7.0 AS base
    WORKDIR /app
    EXPOSE 80
    
    FROM mcr.microsoft.com/dotnet/sdk:7.0 AS build
    WORKDIR /src
    COPY . .
    RUN dotnet restore
    RUN dotnet publish -c Release -o /app
    
    FROM base AS final
    WORKDIR /app
    COPY --from=build /app .
    CMD ["dotnet", "watch", "run", "--urls", "http://+:80"]
    
  2. Mount the Source Code Volume in Deployment YAML:

    apiVersion: apps/v1
    kind: Deployment
    metadata:
      name: my-dotnet-app
    spec:
      replicas: 1
      selector:
        matchLabels:
          app: my-dotnet-app
      template:
        metadata:
          labels:
            app: my-dotnet-app
        spec:
          containers:
          - name: my-dotnet-app
            image: myacr.azurecr.io/mydotnetapp:latest
            volumeMounts:
            - name: source-code
              mountPath: /app
          volumes:
          - name: source-code
            persistentVolumeClaim:
              claimName: azurefile-pvc
    
  3. Deploy to AKS and Start Hot Reload:

    kubectl apply -f deployment.yaml
    

Now, when you update your source code, the changes will reflect in your .NET app without restarting the container.


4. Use Azure DevOps Pipelines to Deploy Just Source Code

Instead of rebuilding the entire container, update only the source code.

Steps to Implement:

  1. Set Up an Azure DevOps Pipeline:

    • Use Azure DevOps Pipelines or GitHub Actions to deploy only source code updates.
    • Configure a build step to sync source code to a persistent volume.
    • Restart only the application process, not the container.
  2. Use Helm to Update the Deployment Without Rebuilding the Image:

    helm upgrade myapp ./helm-chart --set app.sourceVersion=$(git rev-parse HEAD)
    

This will ensure the latest source code is available without triggering a new Docker image build.


Conclusion

The best approach depends on your use case: ✅ For Persistent Source Code Storage: Use Azure File Share with PV/PVC.
For Continuous Sync from Git: Use a sidecar pattern.
For Live Updates During Development: Use .NET Hot Reload.
For Automated Updates in Production: Use Azure DevOps with Helm.

Hope you enjoy please share and comment.🚀

Deploy in AKS web app without rebuilding image and container

 To decouple source code deployment from the container image in an Azure Kubernetes Service (AKS) environment for a .NET web application, you can follow these approaches:

1. Use Persistent Volumes (PV) and Persistent Volume Claims (PVC)

  • Store your source code on an Azure File Share or Azure Blob Storage.
  • Mount the storage as a Persistent Volume (PV) in AKS.
  • Your application pod reads the updated code from the mounted volume without rebuilding the container image.

2. Leverage Azure App Configuration and Feature Flags

  • Store configuration files or dynamic code parts in Azure App Configuration.
  • Use feature flags or environment variables to control runtime behavior without rebuilding the image.

3. Use Sidecar Pattern with a Shared Volume

  • Deploy a sidecar container that continuously fetches updated code (e.g., from Git or a shared storage).
  • The main application container reads from the shared volume.

4. Implement an External Code Server

  • Host the application’s code on an external location (e.g., an Azure Storage Account, NFS, or a remote Git repository).
  • The container only acts as a runtime, pulling the latest code dynamically.

5. Use Kustomize or Helm for Dynamic Config Updates

  • Helm can help manage application deployments, enabling dynamic updates without modifying container images.

6. Use .NET Hot Reload and Volume Mounting

  • If using .NET Core, leverage Hot Reload to apply code changes without restarting the container.
  • Mount the application source code from a storage volume so updates are reflected instantly.

Azure Naming Convention Tools and Best Practices

When working with Microsoft Azure, a well-defined naming convention is crucial for maintaining clarity, consistency, and efficiency across resources. In this guide, we'll explore best practices for naming Azure resources.

Why is a Naming Convention Important?

Following a structured naming convention helps in:

  • Easy resource identification and management.
  • Improved automation and governance.
  • Enhanced collaboration among teams.
  • Reduced ambiguity and errors.

Key Components of an Azure Naming Convention

Each Azure resource name should contain specific elements to provide clarity. A recommended format is:

[Company/Project]-[Workload]-[Environment]-[Region]-[ResourceType]-[Instance]

Example:

contoso-web-prod-eastus-vm01

Best Practices for Azure Naming

  • Use standardized abbreviations: Example: rg for Resource Group, vm for Virtual Machine.
  • Follow a consistent case style: Lowercase for DNS-related resources, PascalCase or camelCase for others.
  • Include environment indicators: Use dev, qa, prod for different environments.
  • Avoid special characters and spaces: Stick to alphanumeric characters and hyphens.
  • Be concise but descriptive: Keep names readable while following Azure’s length limits.

Common Azure Resource Naming Abbreviations

Resource Abbreviation
Resource Group rg
Virtual Machine vm
Storage Account st
App Service app

Tools to Implement Azure Naming Conventions

  • Azure Resource Graph Explorer: Helps in querying and managing resources efficiently.
  • Azure Policy: Enables enforcement of naming conventions automatically.
  • Microsoft Cloud Adoption Framework: Provides best practices and guidance for cloud governance. Learn More

Conclusion

A well-structured Azure naming convention helps keep your cloud resources organized and manageable. By following these best practices, you can ensure clarity, scalability, and consistency in your Azure environment.

References and Tools

Friday, February 7, 2025

Running Parallel Tasks in Azure DevOps YAML Pipeline

1. Running Parallel Jobs

If you want multiple jobs to run in parallel, define them separately under the jobs section.

jobs: - job: Job1 displayName: 'Job 1' pool: vmImage: 'ubuntu-latest' steps: - script: echo "Running Job 1" - job: Job2 displayName: 'Job 2' pool: vmImage: 'ubuntu-latest' steps: - script: echo "Running Job 2"

2. Running Parallel Steps within a Job

Option 1: Using dependsOn for Parallel Execution in Jobs

jobs: - job: Build displayName: 'Build Job' steps: - script: echo "Building the application" - job: Test displayName: 'Test Job' dependsOn: [] # Runs in parallel with Build steps: - script: echo "Running tests" - job: Deploy displayName: 'Deploy Job' dependsOn: [Build, Test] # Runs only after both are completed steps: - script: echo "Deploying the application"

Option 2: Using template for Parallel Execution

Create a separate YAML template file:

# parallel-template.yml steps: - script: echo "Task 1" - script: echo "Task 2"

Then, reference it in the main pipeline:

jobs: - job: ParallelJob steps: - template: parallel-template.yml

Option 3: Using background: true for Background Tasks

steps: - script: echo "Starting Task 1" displayName: 'Task 1' background: true # Runs in the background - script: echo "Starting Task 2" displayName: 'Task 2' background: true # Runs in the background

Best Approach?

  • Use separate jobs if tasks need different agents or environments.
  • Use parallel steps in a job if they share the same environment.
  • Use background tasks for lightweight independent tasks.

Let me know if you need a specific example for your pipeline! 🚀

Wednesday, February 5, 2025

Read ConfigMap of Pods Namespace in AKS using .Net Core

 To fetch ConfigMaps using the above approach, you can modify the code to use the Kubernetes client API for retrieving ConfigMaps.

🔹 Steps to Fetch ConfigMaps in a Namespace

  1. Modify the code to call ListNamespacedConfigMapAsync.
  2. Iterate through the retrieved ConfigMaps.
  3. Extract and display the required details.

Updated C# Code to Fetch ConfigMaps in the openlens Namespace

using System;
using System.Threading.Tasks;
using k8s;
using k8s.Models;

class Program
{
    static async Task Main(string[] args)
    {
        // Load Kubernetes config
        var config = KubernetesClientConfiguration.BuildDefaultConfig();

        // Create Kubernetes client
        IKubernetes client = new Kubernetes(config);

        // Specify the namespace
        string namespaceName = "openlens"; // Change as needed

        try
        {
            // Get the list of ConfigMaps in the namespace
            var configMapList = await client.CoreV1.ListNamespacedConfigMapAsync(namespaceName);

            Console.WriteLine($"ConfigMaps in namespace '{namespaceName}':");

            foreach (var configMap in configMapList.Items)
            {
                Console.WriteLine($"- Name: {configMap.Metadata.Name}");
                Console.WriteLine("  Data:");

                // Display the key-value pairs inside the ConfigMap
                if (configMap.Data != null)
                {
                    foreach (var kvp in configMap.Data)
                    {
                        Console.WriteLine($"    {kvp.Key}: {kvp.Value}");
                    }
                }
                else
                {
                    Console.WriteLine("    (No data)");
                }

                Console.WriteLine(new string('-', 40));
            }
        }
        catch (Exception ex)
        {
            Console.WriteLine($"Error fetching ConfigMaps: {ex.Message}");
        }
    }
}

How This Works

  1. Uses ListNamespacedConfigMapAsync(namespaceName) to get all ConfigMaps in the given namespace.
  2. Iterates through each ConfigMap and prints:
    • Name
    • Key-value pairs (if any)
  3. Handles errors gracefully.

🔹 Steps to Run

  1. Ensure kubectl is configured correctly.
  2. Install the KubernetesClient NuGet package:
    dotnet add package KubernetesClient
    
  3. Run the program:
    dotnet run


Friday, January 24, 2025

Difference Between ID Token, Access Token, and Refresh Token in OAuth & OpenID Connect

Understanding the Difference Between ID Token, Access Token, and Refresh Token in OAuth & OpenID Connect

OAuth 2.0 and OpenID Connect are widely used frameworks for authorization and authentication. These protocols use tokens to securely exchange and validate information between systems. However, understanding the purpose and difference between ID Token, Access Token, and Refresh Token can be challenging. In this article, we’ll break down each token and their specific roles in OAuth and OpenID Connect.

What Is an ID Token?

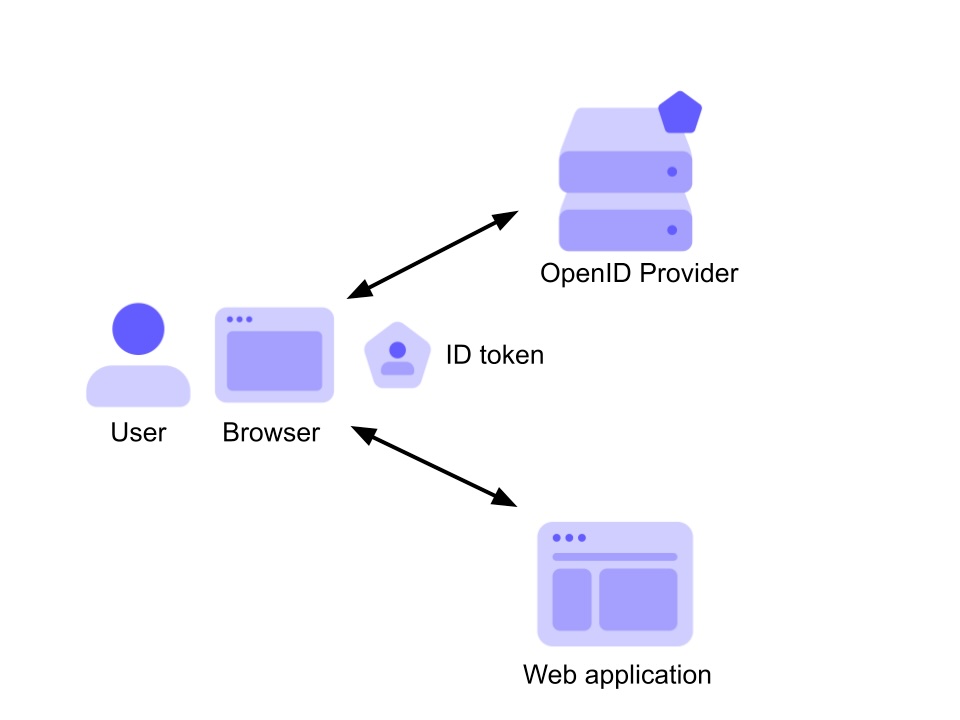
The ID Token is a JSON Web Token (JWT) issued by the identity provider (IdP) as part of the OpenID Connect protocol. Its primary purpose is to authenticate the user and confirm their identity to the client application. The ID Token contains information about the user, such as:

  • Subject (sub): A unique identifier for the user.
  • Issuer (iss): The identity provider that issued the token.
  • Expiration (exp): The token's validity period.
  • Claims: Additional information like the user’s email, name, or roles.
ID Token Scenario

Illustration of an ID Token in action

What Is an Access Token?

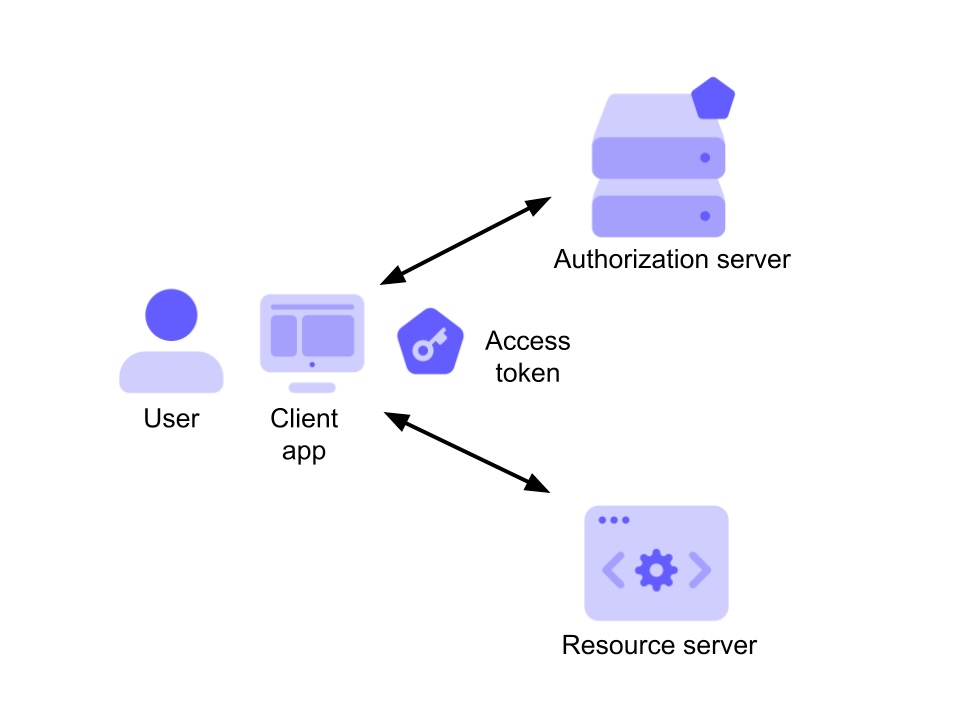
The Access Token is a token issued by the authorization server, enabling the client application to access protected resources (such as APIs) on behalf of the user. Unlike the ID Token, the Access Token:

  • Does not contain user identity information.
  • Is designed to be presented to APIs or resource servers as proof of authorization.
  • Has a short lifespan for security purposes.
Access Token Scenario

Illustration of an Access Token in action

What Is a Refresh Token?

The Refresh Token is a long-lived token used to obtain a new Access Token without requiring the user to log in again. It is issued alongside the Access Token during the authorization process and is stored securely by the client application. Refresh Tokens:

  • Are typically not sent to APIs or resource servers.
  • Have a longer validity period than Access Tokens.
  • Are subject to strict security practices to prevent misuse.

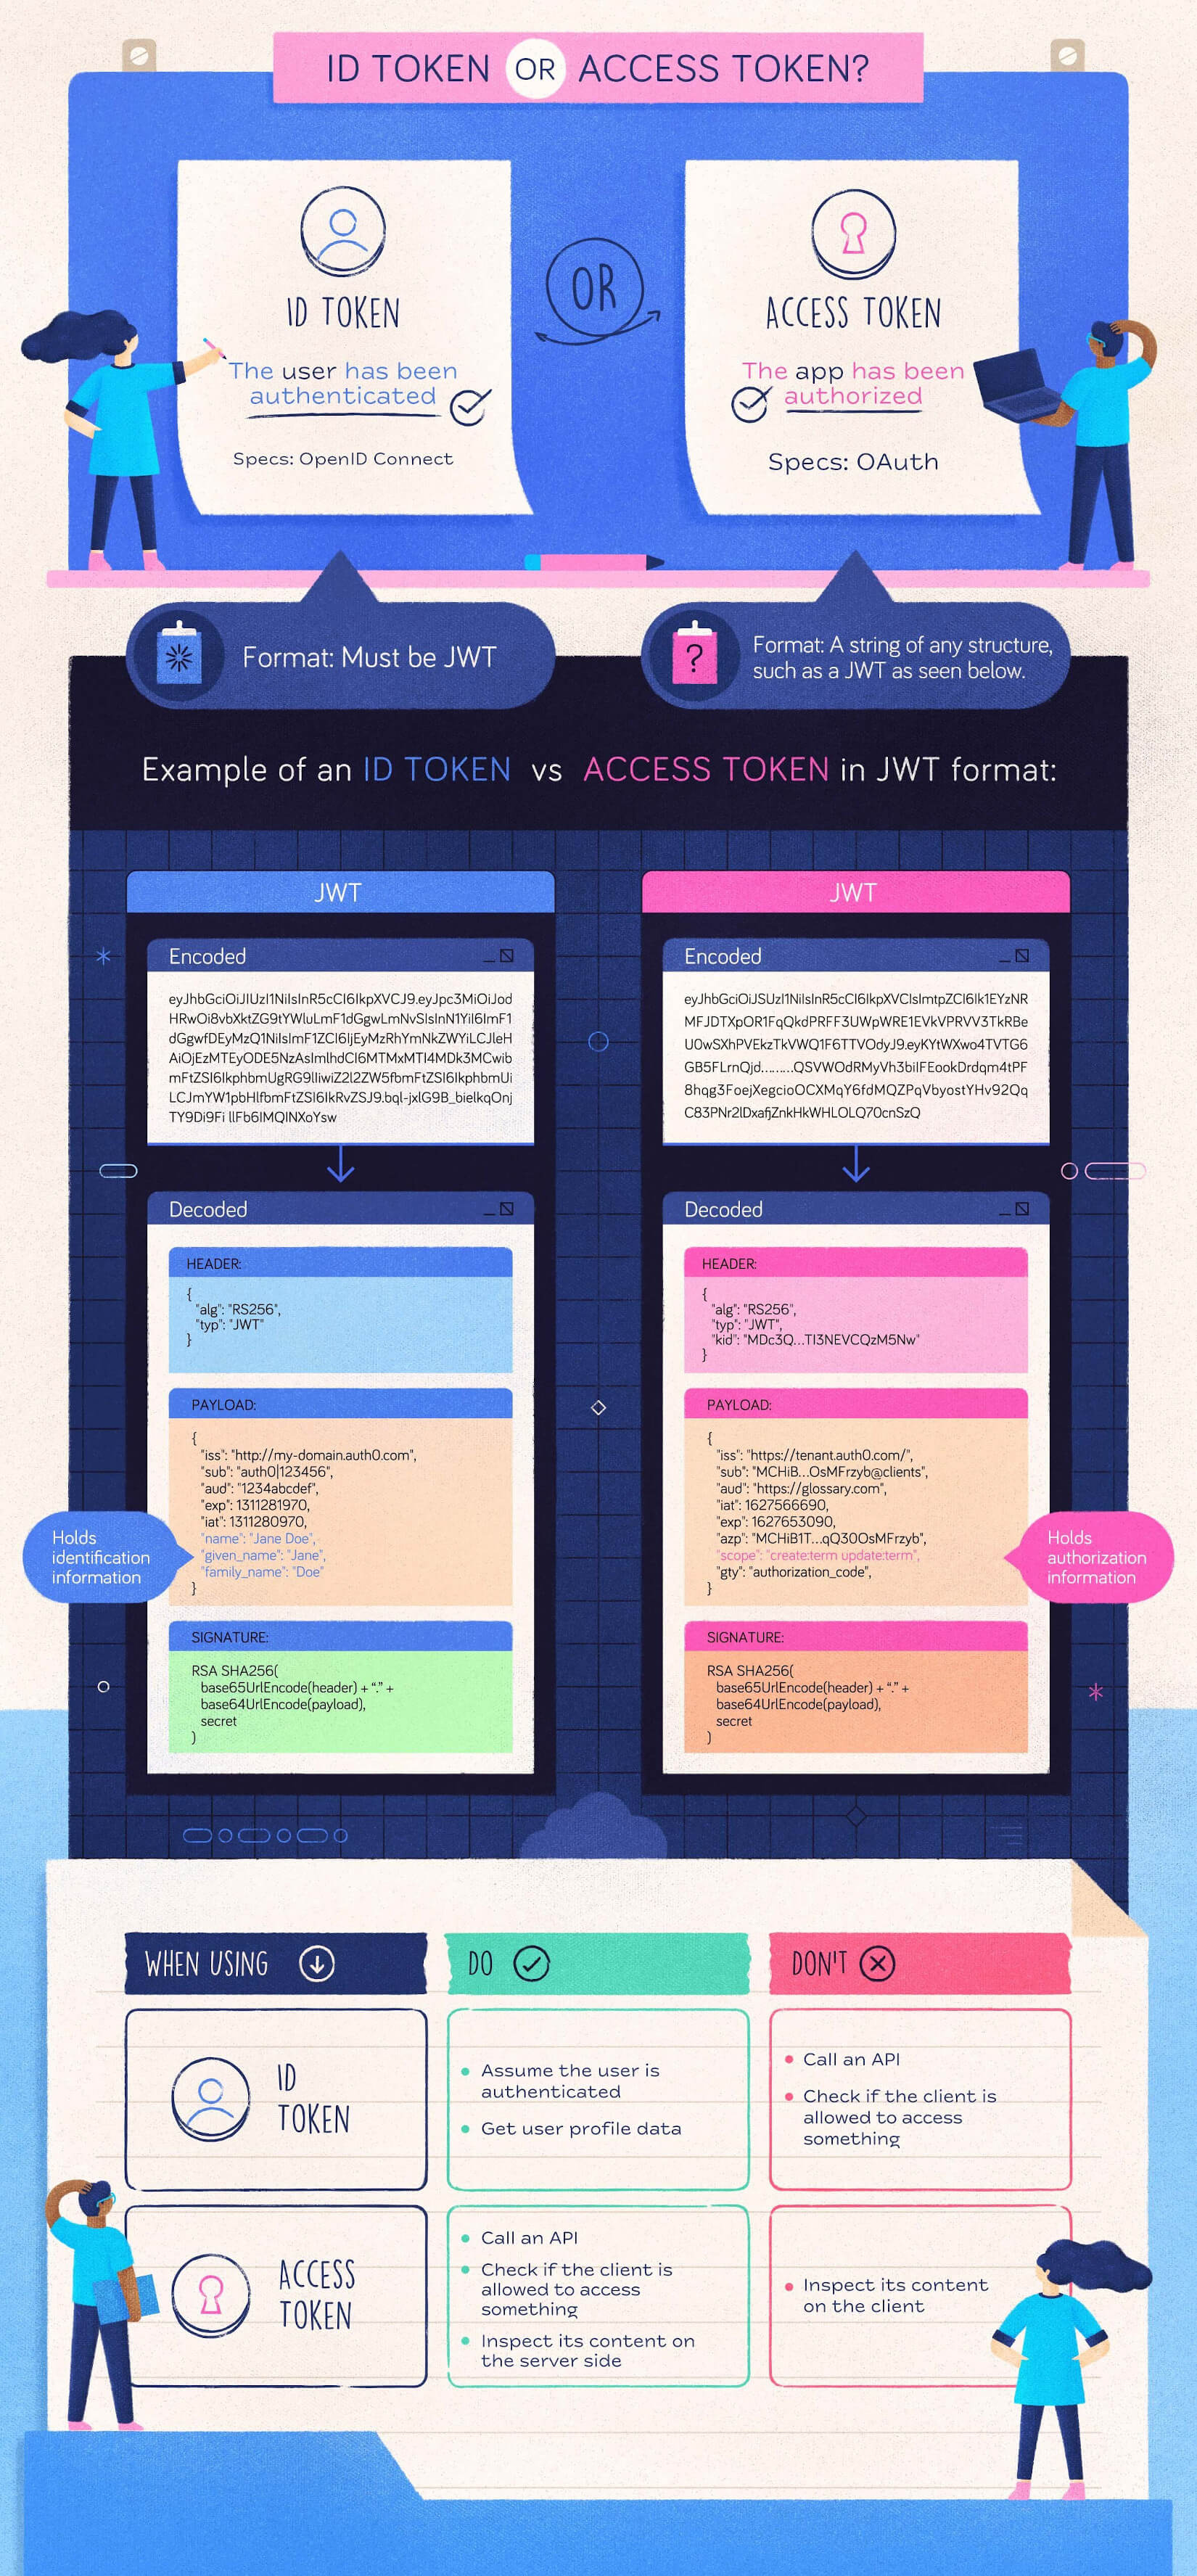
Key Differences at a Glance

Token Type Purpose Contains User Info? Intended Audience
ID Token User authentication and identity confirmation. Yes Client application
Access Token Authorize access to protected resources. No APIs or resource servers
Refresh Token Obtain new Access Tokens without re-authentication. No Authorization server
ID Token vs Access Token Summary

Summary: ID Token vs Access Token vs Refresh Token

Conclusion

Understanding the distinct roles of ID Tokens, Access Tokens, and Refresh Tokens is essential for designing secure and efficient authentication and authorization workflows. While the ID Token is central to user authentication, the Access Token ensures authorized API access, and the Refresh Token enhances user experience by reducing the need for frequent logins.

By using these tokens effectively, you can create robust and secure systems that adhere to modern authentication and authorization standards.

Thursday, January 23, 2025

Understanding Forwarded Headers Middleware in ASP.NET Core

🚀

Introduction

In modern web applications, especially those deployed behind reverse proxies (like Nginx, Apache, or cloud services like AWS and Azure), handling request headers correctly is crucial. The Forwarded Headers Middleware in ASP.NET Core ensures that proxies and load balancers pass the correct client information to the application.

This blog post will cover:
✅ What Forwarded Headers Middleware is
✅ Why it's important
✅ How to configure it in ASP.NET Core with a practical code example


🌟 What is Forwarded Headers Middleware?

When an application is deployed behind a reverse proxy, the proxy modifies request headers. For example:

  • The original client IP is replaced with the proxy server’s IP.
  • The HTTPS scheme may be removed if the proxy forwards requests via HTTP.

To ensure your app detects the correct client details, ASP.NET Core provides the Forwarded Headers Middleware.

🔹 Headers Managed by ForwardedHeadersMiddleware

1️⃣ X-Forwarded-For → Captures the original client IP.
2️⃣ X-Forwarded-Proto → Indicates the original HTTP scheme (HTTP or HTTPS).
3️⃣ X-Forwarded-Host → Contains the original host requested by the client.


🛠️ Configuring Forwarded Headers Middleware in ASP.NET Core

Let’s see how to enable and configure Forwarded Headers Middleware in an ASP.NET Core application.

1️⃣ Install Required Packages (Optional)

If not already installed, ensure the Microsoft.AspNetCore.HttpOverrides package is added:

dotnet add package Microsoft.AspNetCore.HttpOverrides

2️⃣ Configure Forwarded Headers Middleware in Program.cs

Modify your Program.cs file to include the middleware:

using Microsoft.AspNetCore.HttpOverrides;

var builder = WebApplication.CreateBuilder(args);
var app = builder.Build();

// 🌟 Enable Forwarded Headers Middleware
var options = new ForwardedHeadersOptions
{
    ForwardedHeaders = ForwardedHeaders.XForwardedFor | ForwardedHeaders.XForwardedProto
};

// 🔹 (Optional) Allow Known Proxies
options.KnownProxies.Add(System.Net.IPAddress.Parse("192.168.1.100")); 

app.UseForwardedHeaders(options);

// Sample Endpoint to Check Headers
app.MapGet("/", (HttpContext context) =>
{
    var clientIP = context.Connection.RemoteIpAddress?.ToString();
    var originalIP = context.Request.Headers["X-Forwarded-For"].ToString();
    var originalScheme = context.Request.Headers["X-Forwarded-Proto"].ToString();

    return Results.Json(new
    {
        ClientIP = clientIP,
        ForwardedFor = originalIP,
        ForwardedProto = originalScheme
    });
});

app.Run();

🔍 Understanding the Code

🔹 ForwardedHeadersOptions → Specifies which headers to process (X-Forwarded-For, X-Forwarded-Proto).
🔹 KnownProxies → Lists trusted proxies (important for security).
🔹 UseForwardedHeaders(options) → Enables the middleware before other request-processing middleware.
🔹 HttpContext.Request.Headers → Reads the forwarded headers inside an API endpoint.


⚡ Testing Forwarded Headers in Postman or Curl

You can simulate forwarded headers using Postman or cURL:

curl -H "X-Forwarded-For: 203.0.113.42" -H "X-Forwarded-Proto: https" http://localhost:5000

Expected Response (Example Output)

{
    "ClientIP": "::1",
    "ForwardedFor": "203.0.113.42",
    "ForwardedProto": "https"
}

📌 Best Practices

1️⃣ Only trust known proxies → Use KnownProxies or KnownNetworks to avoid spoofing risks.
2️⃣ Enable forwarding at the right stage → Configure before authentication middleware.
3️⃣ Use middleware only behind a proxy → Avoid unnecessary header processing in development.


🎯 Conclusion

The Forwarded Headers Middleware is essential for handling reverse proxy headers in ASP.NET Core applications. It ensures that the application correctly identifies the client IP address and scheme, improving security and logging accuracy.

🔥 Key Takeaways:
✅ Enables handling of X-Forwarded-For, X-Forwarded-Proto, and X-Forwarded-Host.
✅ Necessary for reverse proxy setups (e.g., Nginx, Cloudflare, AWS).
✅ Always configure trusted proxies for security.

👉 Have any questions? Drop them in the comments below! 🚀

Kestrel Web Server in .NET Core

Kestrel Web Server in .NET Core

The **Kestrel Web Server** is a cross-platform, lightweight, and high-performance web server designed specifically for applications built with **.NET Core**. It acts as the default web server for ASP.NET Core applications and is ideal for both development and production environments.

What is Kestrel?

Kestrel is an open-source web server built on top of the **libuv** library (used for asynchronous I/O operations) in earlier versions, but now it leverages **transport abstractions** in .NET for enhanced flexibility and performance. It is optimized for handling both static and dynamic content efficiently.

Key Features of Kestrel

  • Cross-Platform: Runs seamlessly on Windows, macOS, and Linux.
  • High Performance: Designed to handle thousands of concurrent requests with low latency.
  • Asynchronous I/O: Uses async programming patterns for efficient resource utilization.
  • Lightweight: Ideal for microservices and containerized applications.
  • Integration Friendly: Can be used with a reverse proxy like IIS, Nginx, or Apache, or as a standalone server.

How to Configure Kestrel in .NET Core

Configuring Kestrel in a .NET Core application is straightforward. Here's an example of how to set it up in the Program.cs file:


using Microsoft.AspNetCore.Hosting;
using Microsoft.Extensions.Hosting;

public class Program
{
    public static void Main(string[] args)
    {
        CreateHostBuilder(args).Build().Run();
    }

    public static IHostBuilder CreateHostBuilder(string[] args) =>
        Host.CreateDefaultBuilder(args)
            .ConfigureWebHostDefaults(webBuilder =>
            {
                webBuilder.UseKestrel(); // Configuring Kestrel
                webBuilder.UseStartup<Startup>();
            });
}


When to Use Kestrel

  • As a Standalone Server: For lightweight, high-performance applications, especially in microservice architectures.
  • With a Reverse Proxy: Use Kestrel behind IIS, Nginx, or Apache for additional features like load balancing, SSL termination, and security hardening.

Advantages of Kestrel

  • **Performance:** Its lightweight and asynchronous architecture makes it one of the fastest web servers available.
  • **Ease of Use:** Configuration and integration into .NET Core projects are straightforward.
  • **Extensibility:** Kestrel can handle advanced scenarios with middleware components.
"Kestrel is the backbone of ASP.NET Core applications, ensuring high performance and scalability while keeping the server lightweight and efficient."

Conclusion

The Kestrel Web Server is a critical component of the .NET Core ecosystem. Its high performance, lightweight nature, and cross-platform capabilities make it ideal for modern web applications. Whether used as a standalone server or behind a reverse proxy, Kestrel ensures your ASP.NET Core applications are fast, reliable, and production-ready.

Know this difference HTTP/1.1 vs HTTP/2.0

HTTP/1.1 vs HTTP/2.0

HTTP/1.1 vs HTTP/2.0

The evolution of the HTTP protocol from HTTP/1.1 to HTTP/2.0 brought significant performance and efficiency improvements. Let’s explore the differences between these two versions:

Key Differences

  • Multiplexing: HTTP/2.0 allows multiple requests and responses over a single connection, whereas HTTP/1.1 processes them sequentially.
  • Header Compression: HTTP/2.0 uses HPACK compression to minimize header size, improving efficiency compared to the plaintext headers in HTTP/1.1.
  • Binary Protocol: HTTP/2.0 uses a binary protocol, which is faster and less error-prone than HTTP/1.1’s text-based protocol.
  • Server Push: HTTP/2.0 can proactively send resources to the client before they’re requested, a feature missing in HTTP/1.1.
  • Prioritization: HTTP/2.0 allows prioritization of critical resources for faster loading times.
  • Encryption: While optional in HTTP/1.1, HTTP/2.0 implementations often require encryption (TLS).

Comparison Table

Feature HTTP/1.1 HTTP/2.0
Protocol Type Text-based Binary
Multiplexing Not supported Supported
Header Compression No Yes (HPACK)
Server Push Not supported Supported
Prioritization Not supported Supported
Connection Multiple connections needed Single connection sufficient
Security Optional TLS TLS usually required
"HTTP/2.0 is faster, more efficient, and better suited for modern web demands compared to HTTP/1.1."

Summary

In conclusion, HTTP/2.0 introduces significant improvements over HTTP/1.1, such as multiplexing, server push, and header compression, making it faster and more efficient. These enhancements are crucial for delivering a better web experience, particularly for resource-intensive websites.

Mastering Chrome Developer tool Tips and tricks

Basic Console Navigation & Shortcuts

  • Open Console Quickly: Use Ctrl + Shift + J (Windows/Linux) or Cmd + Option + J (Mac) to open the Console directly.
  • Clear Console Output: Use Ctrl + L or type clear() in the Console to clean up clutter.
  • Command Palette: Open the Command Menu with Ctrl + Shift + P (or Cmd + Shift + P on Mac).

Debugging with Console

  • Logging Data: Use console.log() to print variables or messages. For structured output, use console.table():
    const users = [{ name: 'Alice', age: 25 }, { name: 'Bob', age: 30 }];
    console.table(users);
                    
  • Inspect Objects: Use console.dir() to explore DOM elements or objects in detail.
  • Set Breakpoints: Right-click on the line number in the Sources tab to set breakpoints in your code.
  • Monitor Events: Use monitorEvents(element, 'event') to track events on an element:
    monitorEvents(document.body, 'click');
                    
  • Stop Monitoring Events: Use unmonitorEvents(element).

Using Fetch and Debugging Network Calls

  • Fetch Example:
    fetch('https://jsonplaceholder.typicode.com/posts/1')
      .then(response => response.json())
      .then(data => console.log(data))
      .catch(error => console.error('Error:', error));
                    
  • Check Network Logs: View the Network tab to analyze request/response headers, status codes, and payloads.
  • Retry Fetches: Copy fetch() calls directly from the Network tab by right-clicking a request and choosing "Copy as Fetch."
  • Breakpoint on XHR or Fetch: In the Sources > Event Listener Breakpoints, check "XHR Breakpoints" to pause execution whenever a request is sent.

Debugging JavaScript

  • Live Edit Code: In the Sources tab, modify code directly and hit Ctrl + S (or Cmd + S) to save and run updated scripts.
  • Pause Execution: Use the debugger; statement to pause execution where it's placed:
    function myFunction() {
      debugger; // Execution will pause here
      console.log('Debugging...');
    }
    myFunction();
                    
  • Conditional Breakpoints: Right-click on a breakpoint in the Sources tab and set a condition (e.g., i === 5).
  • Stack Traces: Use console.trace() to log the current stack trace.

DOM Debugging

  • Select DOM Elements: Use $0, $1, etc., to reference elements selected in the Elements tab.
  • Find Elements: Use $('selector') or $$('selector') for querying single or multiple elements:
    const buttons = $$('button');
    console.log(buttons);
                    
  • Modify Elements: Select an element in the Elements tab, then modify it in the Console:
    $0.style.color = 'red';
                    

Find Performance Benchmark

  • Measure Performance: Use console.time() and console.timeEnd() to measure code execution time:
    console.time('fetch-time');
    fetch('https://jsonplaceholder.typicode.com/posts')
      .then(response => response.json())
      .then(data => console.timeEnd('fetch-time'));
                    
  • Inspect JavaScript Functions: Type the function name in the Console to view its definition:
    console.log(myFunction.toString());
                    
  • Track Variable Changes: Use watch('variableName') in the Sources tab to monitor changes to specific variables.
  • Format JavaScript in Console: Use JSON.stringify(object, null, 2) to pretty-print objects:
    const data = { name: 'John', age: 25, city: 'New York' };
    console.log(JSON.stringify(data, null, 2));
                    

Find Unused Javascript

You can find unused JavaScript on your website by using the coverage tab in the Chrome DevTools. Press Ctrl/Cmd+Shift+p to open a command menu and type coverage to open the coverage tab. Now, click on the reload button within the coverage tab. The coverage tab tracks all the files and prepares a coverage list for you. Inside the list, you can see all the files have a usage visualisation graph. Click on a row to see the unused code in the sources tab.

Local File Override test changes before pushing to it production

  • Making changes to a production website is not ideal. If you break something, the whole website can go down. Is there a safe option to try out new things without actually changing the production code?
  • Local file overrides are a convenient feature for making tweaks to your website without changing the actual source code. Using local file overrides, you instruct Chrome to use your local modified files rather than using the files coming from the server.
  • To enable local file overrides, go to the sources tab of your Chrome DevTools and click on "enable local overrides". Now create a directory and give Chrome permission to save all the overrides in that directory.

Multiple Cursors One code many places

  • Ever have multiple lines you need to add something to? You can easily add multiple cursors by pressing Cmd + Click (Ctrl + Click) and entering information on multiple lines at the same time.

Capture Screenshots with dev tools

  • Capture a full-page screenshot.
  • Screenshot a node from the Elements panel.
  • Screenshot an area of a page.
  • Screenshot a node larger than the screen size.
  • Customize your screenshot.
  • Screenshot a mobile version of a website, and add a device frame.
  • Capture Screenshot videa

Make Readable Unminify JavaScript code

  • Code minifying is a build technique that is used to decrease the size of code files by removing indentations, spaces, and various other unnecessary things. Browsers can easily read and execute a minified file but for developers, reading a minified file is almost impossible.
  • Using Chrome DevTools, you can easily unminify a JavaScript file. Open the Chrome DevTools and go to the source tab. Then open a minified file from the left file explorer tab. Now click on the {} icon on the bottom of the file editor to unminify a file.

Record screen for automation

  • As a developer, you want to test how your website will react to different user flows. User flows are the journeys that users take on your website. It can be challenging to test a user flow manually, as you may need to repeat the same action again and again to mimic the user.
  • To record a user flow, open the Chrome DevTools and switch to the recorder tab. Now click on the red coloured recording button to start a new recording. Give your recording a unique name so that you can recognise it later. Now press the record button and perform the user flow that you want to record. All your actions, such as clicking buttons and navigating to other pages will be recorded. Once you've finished, click the end recording button, and your user flow is ready to replay. Now you can test your website with this flow automatically, without manual repetition.

© 2025 Don't waste your time on social media learn new things. All Rights Reserved.